The GripOnGas service

Reduce gas consumption by tracking and understanding the patterns in your data. A real-time tool for more efficient operation and reporting.

For who?

  • Companies in the processing & manufacturing industry.
  • Priority to pursue efficiency by eliminating avoidable gas usage.
  • Management aims to begin a continuous data-driven improvement loop.
  • Real-time data is available.
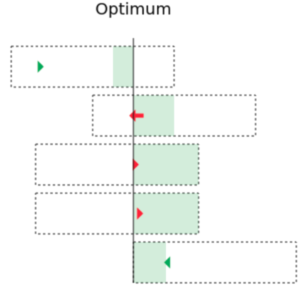
GripOnGas trends widget
The trend widget gives a quick impression of the facility state and where it is going.
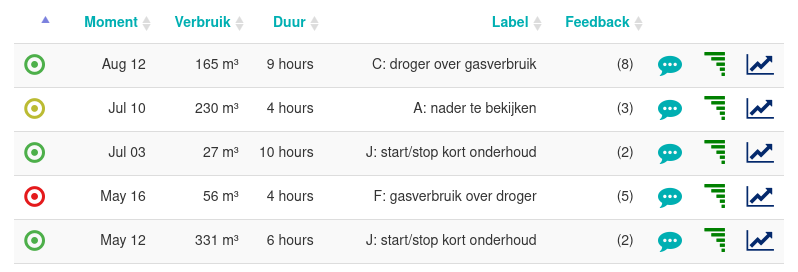
Gas consumption moments in GripOnGas dashboard

Solution

For operators:

  • Gas consumption moments are labelled by our algorithm.
  • Alerts for consumption which is labelled as avoidable.
  • Feedback form to collect knowledge and train algorithm.

For managers:

  • Trend dashboard (see above) for quickly grasping the situation (e.g. to lead meetings).
  • Reports to demonstrate energy efficiency efforts.

The power in your data

Your operator teams are drowning in data. They observe multiple monitors and check many constraints in real time.

We focus with you: Which 4-6 production variables matter the most for this problem?

Based on this, we run our process analytics on your data ― we unearth the gas consumption situations and what led up to them.

Then, our clustering algorithm classifies the moments and labels them. The labels, both for avoidable and normal gas consumption, are fitted to your situation.

We make it easy for your operators to add feedback. Management can discuss situations, and our algorithm can be trained to improve constantly.

Patterns
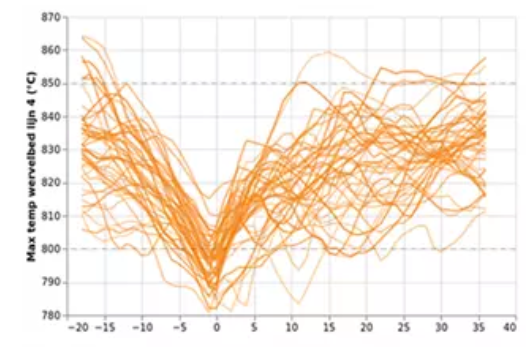
Our algorithm clusters the gas usage moments and finds the patterns.

We are rolling out the GripOnGas service in The Netherlands with Fudura, one of the largest Dutch metering companies.

Report efficiency improvements

Simply reporting what happened in your facilities is the old way to use data ― let’s begin to continuously improve your operations and report efficiency success stories.